PSA level saturates with increasing frequency of sexual activity & bicycling
while MRI remains constant.

[Excerpt in German]

Abstract
The sum of the concentrations of all chemical forms of the prostate specific antigeN, PSA, ("total" PSA concentration) in blood, tPSA, is used alone or in combination with other parameters to predict prostate cancer (PCa) before biopsy. It is known that the quality of the test is considerably reduced when the prostate is mechanically irritated as with sexual activity or bicycle riding. Therefore the effect needs to be quantified before the tPSA test for prostate cancer can be evaluated.

In the reported case (a man during his age interval 64 to 71)

  • irritation induced tPSA variation seems to be comparable or larger than tPSA variation due to prostate cancer.
  • no (signs of or tissue with) prostate cancer was found in

Based on the presented data it is hypothesized that

  • tPSA increases with the frequency of irritation events and
  • the prostate needs a relaxation time larger than one week in order for the tPSA to fall to a base level ("irritation free level"). PSA tests on PCa are supposed to use this irritation free level.
  • when the prostate is irritated several times within the relaxation time, tPSA reaches a saturation level. i.e. hits a maximum. This maximum lies well above the commonly assumed test threshold (tPSA = 4 ng/ml) for suspected PCa.

Results

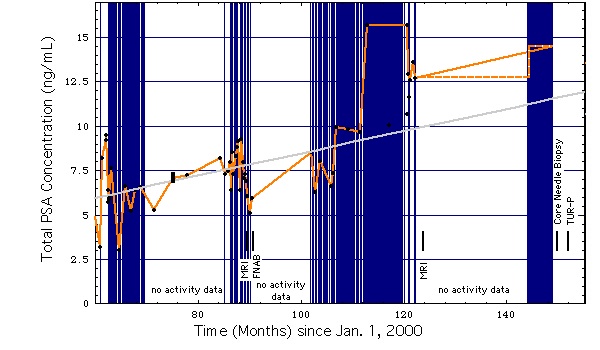
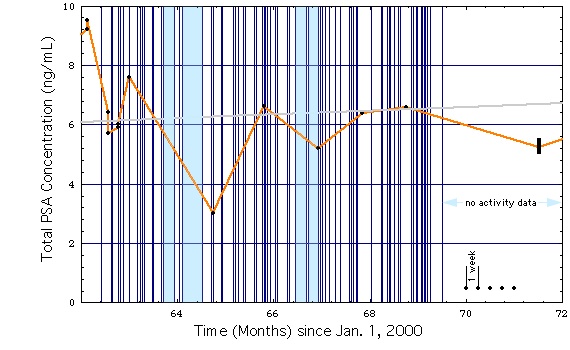
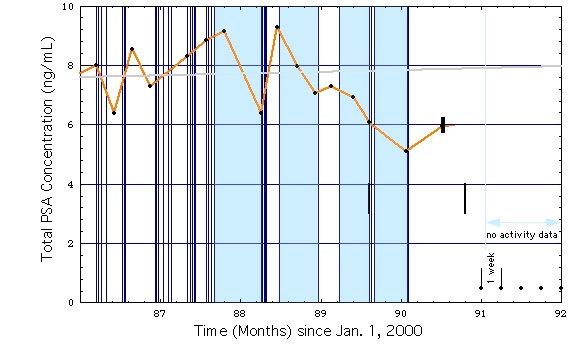
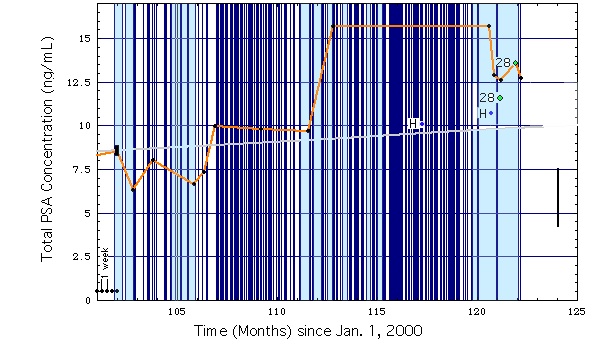
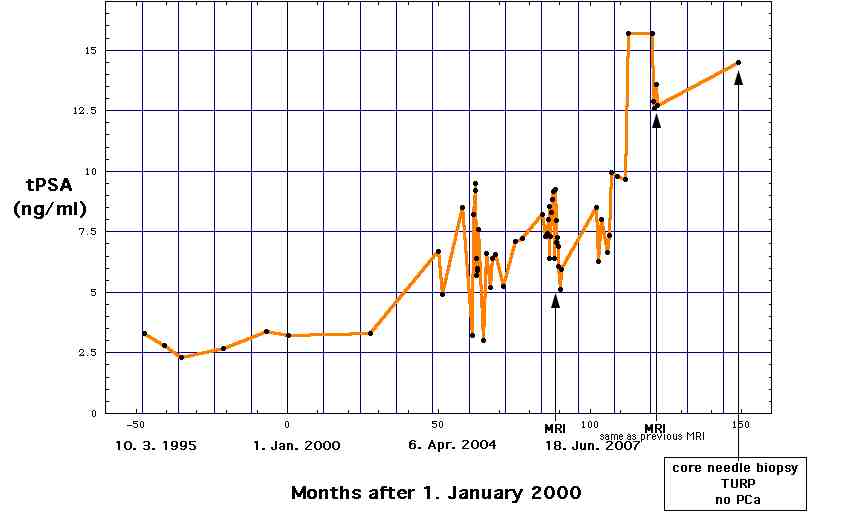
Figures 1a - 1d show that the total PSA level in blood (tPSA) (history and labs) of a man, age 64 at month 63, is correlated with the frequency of his sexual activity or extended bicycling ("prostate irritation").

All diagrams were generated with Mathematica version 2.0. The programs used are myPSA_Data_Defs.ma and myserialpsa.ma. To run the programs

  1. download these files as text files (.txt),
  2. open these files from your hard drive with text editor, one at a time,
  3. copy the files into clipboard, one at a time, and
  4. paste each of the files into its own empty Mathematica window ("notebook").
To execute the programs choose "Evaluate Initialization" from the "Action" menu.

PSA-Level plotted as a Function of Time
Fig. 1a

PSA-Level plotted as a Function of Time, Medium Temporal Resolution ((*) color H: 200-20-100)
Fig. 1b

PSA-Level plotted as a Function of Time, Maximum Temporal Resolution ((*) color H: 200-20-100)
Fig. 1c

PSA-Level plotted as a Function of Time, Maximum Temporal Resolution ((*) color H: 200-20-100, 350-100-100)

Fig. 1d

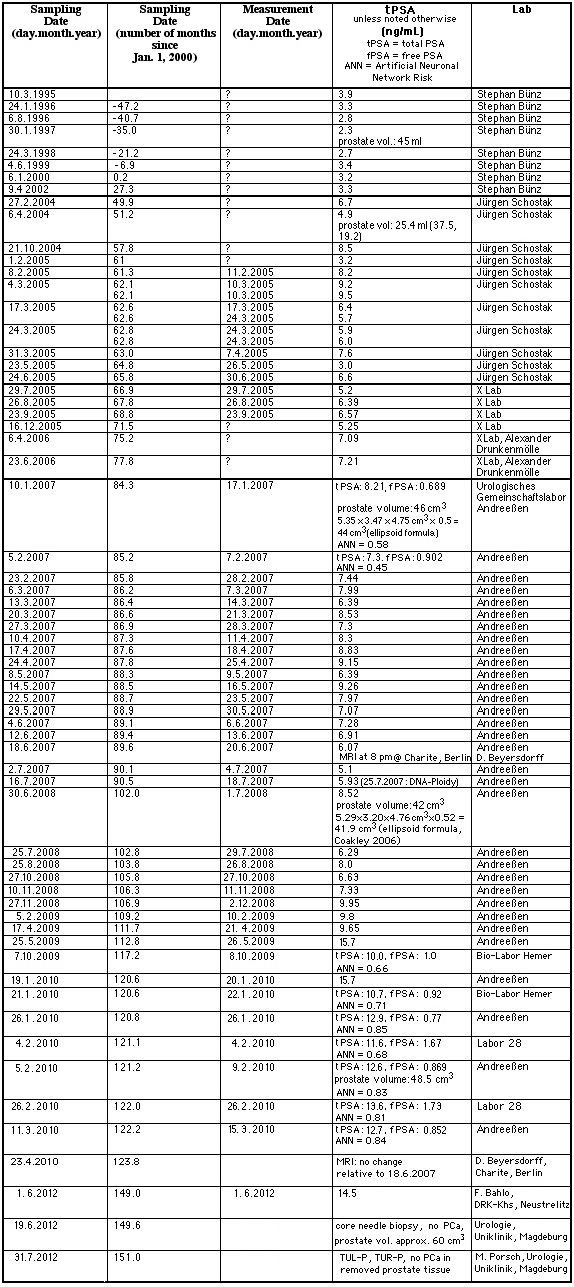
graph of table

click on image to enlarge

Table of 12-Year History of my PSA Values

Figure 1: Total PSA level (tPSA) (history and labs) of a man (64 years of age at month 63) correlates with the frequency of his sexual activity or extended bicycling, the latter being represented by the density of vertical blue lines: tPSA decreases predominantly in light blue areas, i.e. during periods with ample relaxation time between irritation. Blue line density decreases below 1 line per week in those areas.

  • tPSA
    • data points are arbitrarily connected by straight lines. Line polygon is therefore arbitrary during "no activity data" periods, such as in time interval 121 - 144 months, where dotted line represents an equally possible tPSA change.
    • data points in months 117 - 121 represent measurements by 2 additional labs, Bio-Labor Hemer (2 blue points next to letter H) and Labor 28 (green point right of number 28). Therefore they have not been included in the line polygon.
    • was not determined at time 144, the beginning of a period with high activity. tPSA was determined only at the end of this period. Thus the tPSA rise during time interval 144 - 149 is unknown.
  • Error bars (heavy black line attached to a tPSA level)): Standard deviation = +- 0.2 ng/mL, calculated from the coefficient of variation of the measurement of the total PSA level = less than 3 % (Labor 28, Angaben zur Messunsicherheit).
  • Vertical blue lines mark days with sexual activity or extended bicycling.
  • "no activity data": No sexual activity/bicycling data log was kept during time intervals
    • 69 - 72 months,
    • 91 - 102 months and
    • 121 - 144 months.
  • light blue areas: periods with subthreshold sexual activity/bicycling (i.e. less than once per week. Note: For the purpose of orientation 5 dots in the left or right hand lower corner of the diagrams are spaced 1 week apart).
    1. tPSA generally falls during those subthreshold activity periods.
    2. tPSA rises during periods with above threshold activity.
    3. tPSA gradient (change with time, also called "tPSA velocity") seems to depend on level of previous activity as represented by density of lines and duration of activity (thickness of line).
  • Sampling for prostate cancer (PCa):
    4 short vertical lines, two close to each other ("doublett") around month 90, a vertical line at month 124, and another at month 149.6 represent times when sampling for PCa was done:
    1. MRIs were done at times 89.6 and 124 months (details below).
    2. DNA-ploidy analysis was done at time 90.5 months (details below).
    3. Core needle biopsy was done at time 149.6 months (details below).
    4. Transurethral resection of the prostate followed at time 151.1 months (details below)
    None of these samples showed evidence for PCa.
  • Gray straight line with slope 0.75 ng/mL per year represents the threshold PSA level gradient ("PSA velocity") after Coakley FV, Chen I, Qayyum A, Westphalen AC, Carroll PR, Hricak H, Chen MH, Kurhanewicz J. Validity of prostate-specific antigen as a tumour marker in men with prostate cancer managed by watchful-waiting: correlation with findings at serial endorectal magnetic resonance imaging and spectroscopic imaging. BJU Int. 2007 Jan;99(1):41-5 (more).
  • see also "biological tPSA variation of up to 20-30% in the tPSA range 0.1-20 ng/ml" in: Soeletormos G et al., "Biological variation of total prostate-specific antigen: A survey of published estimates and consequences for clinical practice", Clin. Chem 51: 1342-1351, 2005
The sum of the concentrations of all chemical forms of PSA in the prostate, tPSA(prostate), is many orders of magnitude higher than tPSA in blood (the one that is used for the PSA test for PCa, dealt with here in this paper). This may serve as an explanation for the well known rise of tPSA with prostate irritation, particularly with the frequency of sexual activity/bicycling, displayed in Figures 1 a - d. These figures quantify the relaxation behavior of the prostate, i.e. the decrease of the tPSA level in blood after prostate irritation has ceased:
  1. When prostate irritation is discontinued for 1 week or longer, then tPSA tends to fall. In the figures such irritation gaps are shown in light blue.
  2. Generally, the prostate needs a relaxation time of at least 1 week in order for tPSA to fall to its irritation free level.
  3. tPSA relaxation time seems to depend on the frequency of irritation: After a period with frequent irritation (Fig. 1d) tPSA needs more time to fall (by e.g. 1 ng/ml) than after medium irritation (Figs. 1 b, c).
  4. When the prostate is given no time to relax, i.e. is continuously re-irritated within relaxation time intervals (as in the period after 144 months, Fig. 1a), the tPSA level seems to hit a maximum, i.e. approach a saturation level. This tPSA saturation level is well above the PSA test threshold for PCa, mimicing cancer where there is none, as demonstrated by
In a separate paper an attempt is made to factor out sexual activity in order to isolate the effect of prostate cancer on tPSA.

APPENDIX

Magnetic Resonance Images
made at times June 18, 2007 and April 23, 2010 marked by left line near month 90 and line near month 124 in figures above
D. Beyersdorff, T. Elgeti, B. Hamm


Why diagnosing with MRI?
Sensitivity and specificity of MRI vs. core needle biopsy.
Improving MRI diagnostics.

D. Beyersdorff, A. Winkel, B. Hamm, S. Lenk, S.A. Loening, 2005 "MR Imaging-guided Prostate Biopsy with a Closed MR Unit at 1.5 T: Initial Results" (in cache), Radiology. 2005 Feb;234(2):576-81. Epub 2004 Dec 22.

Technik
MRT mit der kombinierten Endorektal-Körper-Phased-Array-Spule bei 1.5 Tesla. Lokalisationsscan,

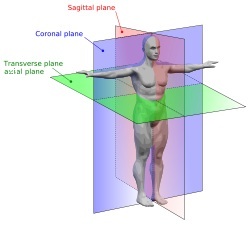
wikipedia human anatomy planes
Source: Wikipedia

  • axiale T1-weighted TSE,
  • coronare T2-weighted TSE,
  • axiale PD-weighted TSE.

Transverse and coronal T2-weighted images were evaluated for hypointense regions in the peripheral zone of the prostate.

QuickTime movies showing the stacks of layers of my transverse and coronal Magnetic Resonance Images (layer thickness: 3 mm, interlayer gap = 0.3 mm, field of view: 16 cm):
  • Transverse T1-weighted turbo SE sequence
    • t1_tse_tra.mov (t1_tse_tra.mp4), repetition time/echo time = 740 msec/13 msec; echo train length = 3 msec (?) (2.4 MB)
      (Gruber, Joachim: 07.04.1941, Study: 14.07.46 - Time: 19:50:50 - Date: 18/06/2007)
  • Transverse T2-weighted turbo SE images
    • T2_tse_tra.mov (T2_tse_tra.mp4), repetition time/echo time = 4660 msec/100 msec; echo train length = 7 msec (?) (2.9 MB)
      (Gruber, Joachim: 07.04.1941, Study: 14.07.46 - Time: 19:33:40 - Date: 18/06/2007)
    • PD_tse_tra_512.mov (PD_tse_tra_512.mp4), (repetition time/echo time = 2260 msec/100 msec; echo train length = 7 msec (?) (1.1 MB)
      (Gruber, Joachim: 04.07.1941, Study: 14.07.46 - Time: 19:21:02 - Date: 18/06/2007)
  • Coronal T2-weighted turbo SE images (repetition time/echo time = 4000 msec/100 msec; echo train length = 7 (?))

QuickTime Player Free Download
Literature on Magnetic Resonance Imaging

coronal view of prostate
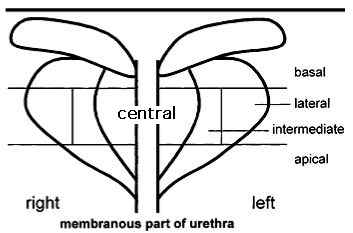
Schematic of Prostate Zones - Coronal View
(Source: Beyersdorff D et al, Magnetic resonance (MR), Patients with a History of Elevated Prostate-Specific Antigen Levels and Negative Transrectal USÐguided Quadrant or Sextant Biopsy Results: Value of MR Imaging", in cache), Radiology. 2002 Sep;224(3):701-6)

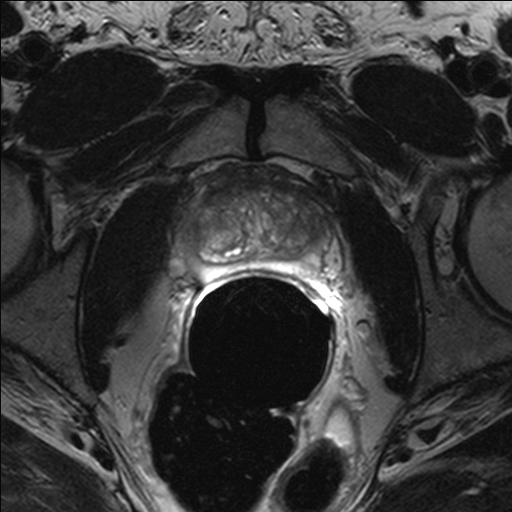
transverse T2-weighted image
T2-weighted transversal image #13 (total stack of layers: T2_tse_tra.mov)
Example MR images from a different patient

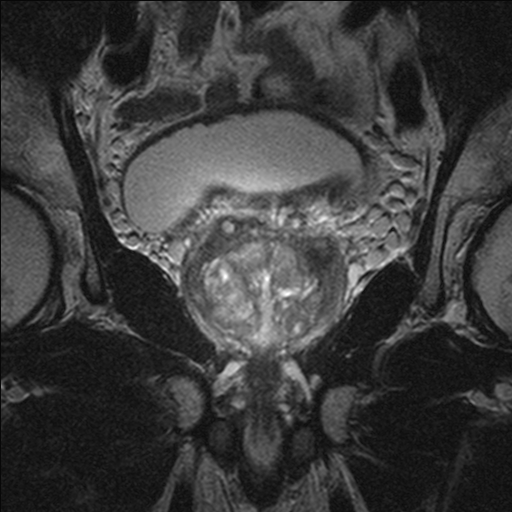
transverse T2-weighted image
T2-weighted coronal image #11 (total stack of layers: T2_tse_cor.mov, T2_tse_cor.mp4)
(Gruber, Joachim: 07.04.1941 - Study: 14.07.46 - Time: 19:42:06 - Date 18/06/2007)


Findings 18. June 2007
Prostate as a whole is enlarged. The zonal structure is intact. The central zone is enlarged to a small extent as part of a BPH (Benign Prostate Hyperplasia).

In the peripheral zone the T2-weighted image showed low signal intensity areas

  1. right laterally
  2. left dorsobasally
In the T1-weighted image no signal-intense formations are delineable.

No indication of growth exceeding the capsula. No infiltration into the seminal bladders, the urinal bladder or the rectum. No indication of pathologially enlarged pelvic lymph nodes. Little free pelvic liquid.

Summary 18. June 2007
  1. Together with a Benign Prostate Hyperplasia we find moderately cancer suspicious areas (grade 3 ... 4 on a scale from 1 (insignificant) to 6 (highly significant)). They show up
    • (1) right laterally
    • (2) left dorsobasally.
    These might be targeted in a biopsy. No enlarged lymph nodes suspicious for metastasis.
  2. Little free liquid, pelvic anamnesis?

Befund 18.6.2007
Die Prostata ist insgesamt vergrößert. Die zonale Gliederung ist intakt. Die zentrale Zone ist im Sinne einer BPH (Benigne Prostata-Hyperplasie) gering vergrößert.

In der peripheren Zone zeigen sich im T2-weighted Bild signalarme Veränderungen

  1. rechts lateral und
  2. links dorsobasal.
Im T1-weighted Bild keine signalreichen Formationen abgrenzbar.

Kein Anhalt für ein kapselüberschreitendes Wachstum. Keine Infiltration in die Samenblasen, die Harnblase oder das Rektum. Kein Nachweis pathologisch vergrößerter Lymphozytenknoten pelvin. Geringe freie Flüssigkeit pelvin.

Zusammenfassende Beurteilung 18.6.2007
  1. Bei Zeichen einer benignen Prostatahyperplasie finden sich mäßig tumorsuspekte Areale (Grad 3 ... 4 auf einer Skala von 1 (unbedeutend) bis 6 (sehr bedeutend)). Sie lassen sich
    1. rechts lateral und
    2. links dorsobasal
    nachweisen.

    Diese sollten bei einer Biopsie ggf. gezielt berücksichtigt werden. Keine metastasensuspekt vergrößerten Lymphknoten.

  2. Gering freie Flüssigkeit, pelvin Anamnese?

Befund 23.4.2010
Voraufnahmen vom 18.6.2007 zum Vergleich.
Die Prostata ist insgesamt vergrößert. Die zonale Gliederung ist intakt. Die zentrale Zone ist im Sinne einer BPH gering vergrößert.

In der peripheren Zone zeigen sich beidseitig zwischen mittlerer Höhe und Basis T2-weighted heterogene bis hypointense Veränderungen, größtenteils zystisch-knotig imponierend, mit geringer Betonung

  1. rechts lateral und
  2. links dorsobasal.
Befund in weitestgehender Konstanz zur Voruntersuchung.

Im T1-weighted Bild in entsprechender Lokalisation keine signalreichen Formationen.

Weitere Befunde:

  • Harnblase mit geringer trabekulärer Betonung, ansonsten unauffällig.
  • Samenblasen und Rektum unauffällig.
  • Kein Nachweis pathologisch vergrößerter Lymphknoten pelvin.
  • Aktuell allenfalls minimale freie Flüssigkeit prärektal.
  • Konstant ovaläre zystische Läsion am ventralen Übergang Femurkopf/-hals, in erster Linie einer transkortikalen Synoviaherniation entsprechend, und kleines (max. 8 mm) Sklerasierungsareal rechts iliacal.
  • Dorsale Bandscheibenprotrusionen bei LWK3/4-5/SWK1, bei 3/4 DD kleiner Prolaps, hier zudem Osteochondrose.
Zusammenfassende Beurteilung 23.4.2010
Im Wesentlichen konstantes Bild einer benignen Prostatahyperplasie mit Strukturstörungen in der peripheren Zone, die aber, nach negativer Stanzbiopsie und weitestgehender Konstanz seit 2007, in erster Linie als unspezifisch, z.B. postentzündlich oder bei chronischer Prostatitis zu werten sind.

Somit ergibt sich aktuell MR-morphologisch kein Anhalt für ein Prostata-Carcinoma.

NB: Mäßig ausgeprägte Balkenblase.


"Dadurch, daß im Juli 2012 kein Tumor nachgewiesen wurde, ist im längeren Verlauf klar, daß 2007 kein schlecht differenzierter Tumor vorlag. Der hätte inzwischen größer sein und nachgewiesen werden müssen.

Leider ist die MRT nicht sehr spezifisch, so daß auch andere Veränderungen, wie z.B. eine Prostatitis, eine tumorsuspekte MR-Veränderung hervorrufen können. Verbesserungen können sich durch einen multimodalen Ansatz mit

  • MR-Spektroskopie,
  • dynamischer kontrastverstärkter MRT und
  • diffusionsgewichteter MRT
ergeben. Aber auch diese Techniken sind nicht so spezifisch, daß man auf eine Biopsie verzichten kann.

Aus meiner Sicht ist ein MRT dennoch gerechtfertigt, um

  • einerseits suspekte Areale nachzuweisen und ggf. gezielt zu biopsieren und
  • sie andererseits im Verlauf zu kontrollieren.
Das Letztere wäre für das Konzept der "active surveillance" von Bedeutung.

Wenn das MRT negativ ist, sind

  • positive Ergebnisse in der Biopsie selten und dann
  • -wenn überhaupt- allermeistens gut differenzierte Tumore vorhanden, bei denen ein verzögerter Nachweis akzeptabel ist."

Quelle: D. Beyersdorff, Email-Kommunikation, 17.8.2012


Befund am 11.12.2023
in der Radiologie Schšneberg, Richard-von-Weizsäcker-Platz 3, 10827 Berlin
Exam-#: 2940869, Access Code: AF2-CXW-6LH
https://easyradiology.net/view/p8orqwg5-4m5ng428-9bi9hrpu-qe3x4u22#AF2-CXW-6LH


Fine Needle Aspiration Biopsy and DNA-Ploidy Analysis
made at time July 25, 2007 marked by right line near month 90 in figures above
H. Al-Abadi

Why Fine Needle Aspiration Biopsy?

Cytological Assessment
  1. right: 2 samples with sufficient cell material, many larger or smaller regularly structured prostata epithelium agglomerates having uniform nuclei and regular nuleus-plasma relation. Foci of round cell infiltrates consisting predominantly of granulocytes, lymphocytes, and histiocytes (macrophagi).
  2. left: 2 samples with sufficient cell material, many larger or smaller regularly structured prostata epithelium agglomerates having uniform nuclei and regular nuleus-plasma relation.
    • Left lateral: Clear signs of inflammation with predominantly granulocytes and lymphocytes.
  3. Summary Prostate epithelium agglomarates typical for hyperplasia. Chronic recurrent inflammation, in particular left laterally, no indication of malignancy.
Zytologische Begutachtung
  1. Rechts: Bei ausreichendem Zellmaterial aus 2 Ausstrichpräparaten erkennt man zahlreiche größere und kleinere, regelrecht strukturierte Prostataepithelverbände mit uniformen Kernen und regelhafter Kernplasmarelation. Herdförmig finden sich schüttere runde Zellinflitrate überwiegend aus Granulozyten, Lymphozyten und Histiozyten.
  2. Links: Bei ausreichendem Zellmaterial aus 2 Ausstrichpräparaten erkennt man zahlreiche, regelrecht strukturierte, größere und kleinere Prostataepithelverbände mit uniformen Kernen und regelhafter Kernplasmarelation.
    • Links lateral: Hier erkennt man zusätzlich eine deutliche Entzündungsreaktion überwiegend aus Granulozyten und Lymphozyten.
  3. Zusammenfassende Begutachtung Es handelt sich hier um unauffällige Prostataepithelverbände im Sinne der Hyperplasie, mit einer chronisch rezidivierenden Entzündungsreaktion, besonders linkslateral, ohne Anhalt für Malignität.
Image Cytometry
Prostate epithelia were stained (Feulgen reaction) and analyzed. Quantitative image cytometry analysis of the cells showed a diploid DNA histogram with a DNA index 1.00 which corresponds to the norm.
Bildzytometrische Begutachtung
Die beschriebenen Prostataepithelien wurden nach Umfärben mit der Feulgenreaktion DNA-zytometrisch untersucht. Die quantitative bildzytometrische DNA-Analyse der Zellen ergab ein diploides DNA-Histogramm mit einem DNA-Index von 1.00 und entspricht der Norm.

Core Needle Biopsy (Stanzbiopsie)
made on June 20, 2012, marked by vertical line at month 149.6 in figures above
Albert Roessner
Zentrum für Pathologie und Rechtsmedizin (ZPR): Institut für Pathologie (IPA), Direktor
Otto-von-Guericke-Universität Magdeburg
Leipziger Straße 44, 39120 Magdeburg
E-Mail: albert.roessner@med.ovgu.de

Histology
Macroscopy
Histologischer Bericht
Makroskopie
Prostatastanzen rechts:
  1. Apex lateral: 1 Stanzzylinder von 1,1 cm Länge.
  2. Apex medial: 2 Stanzzylinder von 1,2 cm Länge.
  3. Seitenlappen distal-lateral :1 Stanzzylinder von 0,9 cm Länge.
  4. Seitenlappen mittel-lateral: 1 Stanzzylinder von 1,9 cm Länge.
  5. Seitenlappen proximal-lateral: 1 Stanzzylinder von 2,0 cm Länge.
  6. Basis blasenhalsnah: 1 Stanzzylinder von 1,0 cm Länge.

Prostatastanzen links:

  1. Apex lateral: 1 Stanzzylinder von 1,2 cm Länge.
  2. Apex medial: 1 Stanzzylinder von 1,3 cm Länge.
  3. Seitenlappen distal-lateral: 1 Stanzzylinder von 1,5 cm Länge.
  4. Seitenlappen mittel-lateral: 1 Stanzzylinder von 1,4 cm Länge.
  5. Seitenlappen proximal-lateral: 1 Stanzzylinder von 1,4 cm Länge.
  6. Basis blasenhalsnah: 2 Stanzzylinder von 1,1 cm Länge.
Critical report:
#1. - #12.: PCa free prostate tissue
Kritischer Bericht:
Es handelt sich in #1. bis #12. um karzinomfreies Prostatagewebe.

Transurethral Laservaporation (TUL-P) and Resection (TUR-P) of the Prostate
(Transurethrale Vaporisation/Resektion von Prostatagewebe)
(im Cache)

made on July 31, 2012, marked by vertical line at time 151 months after January 1, 2000 in figures above

Martin Schostak
Universitätsklinik für Urologie und Kinderurologie
Prof. Dr. med. Martin Schostak, Klinikdirektor
Otto-von-Guericke-Universität Magdeburg
Leipziger Straße 44, 39120 Magdeburg
Email: martin.schostak@med.uovgu.de
Internet: http://urologie.uni-magdeburg.de
Sekretariat: susanne.henke@med.ovgu.de
Stationäre Aufnahme: manja.schrader@med.ovgu.de


zum Vergrößern auf Bild klicken

Datum des Abschlussberichts: 4.8.2012

Diagnosis
Benign Prostate Hyperplasia (ICD N40)
  • permanent catheter in long-term application after acute urinary retention,
  • negative prostate core needle biopsy in June 2012, PSA = 14.5 ng/ml.
Diagnose
Benigne Prostatahyperplasie (ICD N40)

Therapy
  • TUL-P (laser evaporation of prostate tissue, OPS 5-601.71) on July 31, 2012,
  • TUR-P (transurethral excision and destruction of prostate tissue, OPS 5-601.71) on July 31, 2012.

Therapie
  • TUL-P (transurethrale Laservaporisation der Prostata, OPS 5-601.71) am 31.7.2012,
  • TUR-P (transurethrale Resektion der Prostata, OPS 5-601.71) am 31.7.2012.

Histology H10662/12
  • Prostate tissue with signs of a myoglandolar hyperplasia (clinical diagnosis: BPH).
  • No signs of malignancy.

Histologie H10662/12
  • Es handelt sich um Prostatgewebe mit Zeichen einer myoglandulären Hyperplasie im Sinne der klinisch angegebenen BPH.
  • Kein Anhalt für Malignität.

Anamnesis
Patient has permanent catheter long-term application after acute urinary retention. Serologic suspected prostate carcinoma (PSA = 14.5 ng/ml). Malignancy was excluded in June 2012 (core needle biopsy). On these grounds operative desobstruction during hospitalization was indicated.

Anamnese
Bei dem Patienten besteht eine DK-Dauerversorgung bei Z.n. AHV [akuter Harnverhalt am 29.5.2012 mit Harnvolumen = 1.5 Liter]. Ein Malignomausschluss bei serologischem Verdacht auf Prostata-Carcinom war im Juni 2012 erfolgt. Es wurde die Indikation zur operativen Desobstruktion gestellt, weswegen die aktuelle stationäre Aufnahme erfolgte.

Status on entry into hospital
  • 71 year old patient in good general health and lean nutritional condition. Normal cardiopulmonary findings. Abdomen is soft, without evidence of resistance or pain. Kidneys indolent on both sides.

  • Digital Rectal Exam: prostate enlarged and clearly hardened palpable, no signs for suspect focal leasions. Sulcus shallow, mucosa relocatable, no blood, no faeces on thimble

  • Urosonography on July 26, 2012: kidneys on both sides without signs of stone, obstruction of urinary flow or tumor. Bland lower pole cyst on right side, 50 mm in diameter. Bladder well filled with permanent catheter in place, endovesically protruding prostate medium lobe. No sign for exophytic tumor process.

    TRUS: prostate volume appr. 60 ml, homogeneous echo texture, no sign of suspect focal leasons, prostate on all sides well defined.

Aufnahmestatus
  • 71-jähriger Patient in gutem Allgemein- und schlankem Ernährungszustand. Kardiopulmonaler Normbefund. Das Abdomen ist weich, ohne Nachweis für Resistenzien oder Schmerz. Nierenlager beiderseits indolent.
  • Digital-rektale Untersuchung: Drüse vergrößert und deutlich verhärtet papabel, kein Hinweis auf suspekten Herdbefund. Sulcus verstrichen, Schleimhaut verschieblich, kein Blut, kein Stuhl am Fingerling.
  • Urosonographie vom 26.7.2012: Nieren beidseits ohne Hinweis für Stein, Harnstau oder Tumor. Blande Unterpolzyste rechts von ca. 50 mm Durchmesser. Harnblase gut gefüllt bei liegendem DK, endovesikal entwickelter Prostatamittellappen. Kein Hinweis auf exophytisch wachsenden Tumorprozeß.

    TRUS: Volumen ca. 60 ml, homogene Echotextur, kein Hinweis auf suspekten Herdbefund. Drüse allseits gut abgrenzbar.

  • Laborparameter vorstationär (Eingangsdatum: 23.7.12, EIngangszeit: 14:43 Uhr, Labor-Nr. RL000459)
    Untersuchung Aktuelles Ergebnis Referenzbereich
    Natrium 143 135 - 145 mmol/l
    Kalium 4.35 3.5 - 5.10 mmol/l
    Chlorid 106 98 - 107 mmol/l
    Calcium 2.34 2.15 - 2.55 mmol/l
    Creatinin 75 59 - 104 mmol/l
    CKD-EPI 1.46 ml/sec -
    CKD-EPI 88 ml/min -
    Harnstoff 7.6 < 11.9 mmol/l
    C-reaktives Protein 3.1 < 5.00 mg/l
    TSH (Thyreotropin) 1.02 0.27 - 4.2 mU/l
    FT4 (freies T4) 12.7 12.0 - 22.0 pmol/l
    Infektionsserologie
    HBsAg negativ negativ
    Anti HCV negativ negativ
    HIV 1/2 sep. Bef. negativ
    TPZ (Quick) > 120 > 70 %
    INR 0.93 -
    PTT 29.7 < 35.0 sec
    Blutbild
    Leukozytenzahl 6.4 4.00 - 10.0 Gpt/l
    Erythrozytenzahl 5.02 4.50 - 6.00 Tpt/l
    Hämatokrit 0.45 0.40 - 0.53
    Hämoglobin 9.0 8.60 - 11.0 mmol/l =
    13.9 - 17.7 g/dl
    MCV 89 80 - 96 fl
    MCH 1.79 1.70 - 2.00 fmol
    MCHC 20.1 20.2 - 22.7 mmol/l
    Eryth.-Verteilungsbr. 13.1 11.5 - 14.5 %
    Thrombozytenzahl 222 140 - 360 Gpt/l
    Hypochrome Erythro. 0.8 < 5 %

Therapy and results
TUL-P done on July 31, 2012. Because of heavy prostate bleeding, surgery had to switch to TUR-P. Postoperative progress without complications. Transurethral permanent catheter could be removed on 3. day after surgery. Urinary flow on 4. day after surgery: Qmax = 26 ml/sec, urin volume 384 ml. Residual urinary volume on sonography: 4 ml.

(Translation used dictionary of medical terms)

Therapie und Verlauf
Die TUL-P wurde am 31.7.2012 durchgeführt. Bei starker intraoperativer Blutung aus der Drüse mußte der Wechsel auf TUR-P erfolgen. Der postoperative Verlauf gestaltete sich unaufffällig. Der transurethrale Dauerkatheter konnte am 3. postoperativen Tag entfernt werden. Im postoperativen Uroflow war Qmax = 26 ml/sec bei einem Miktionsvolumen = 384 ml. Sonographisches Restharnvolumen = 4 ml.


Umrechnungsfaktoren

Quelle: Universitätsklinik Düsseldorf, Heinrich-Heine-Universität Düsseldorf

Parameter Einheit Faktor Einheit
ACTH pg/ml x 0,2202 = pmol/l
Adrenalin ng/24h x 5,46 = pmol/d
AFP ng/ml x 0,83 = U/ml
Albumin g/dl x 144,93 = µmol/l
Aldosteron ng/l x 2,77 = pmol/l
Ammoniak µg/dl x 0,58 = µmol/l
Androstendion ng/ml x 0,0349 = nmol/l
Äthanol mg/dl x 6,915 = µmol/l
b-OH-Butyrat mg/dl x 96,05 = µmol/l
Bilirubin mg/dl x 17,104 = µmol/l
Blei µg/l x 0,004826 = µmol/l
Calcium mmol/l x 4,008 = mg/dl
Calcitonin ng/l x 0,28 = pmol/l
Chlorid mmol/l x 3,5453 = mg/dl
Cholesterin mg/dl x 0,0259 = mmol/l
Cortisol µg/l x 2,76 = nmol/l
Creatin mg/dl x 76,254 = µmol/l
C-Peptid µg/l x 0,33 = nmol/l
DHEA-S µg/l x 0,0025 = µmol/l
Eisen µmol/l x 5,5847 = µg/dl
EBK µmol/l x 5,5847 = µg/dl
Fett im Stuhl g/die x 3,515 = mmol/l
Fibrinogen g/dl x 29,41 = µmol/l
Folsäure ng/ml x 2,266 = nmol/l
Glucagon ng/l x 0,2869 = pmol/l
Glukose mg/dl x 0,05551= mmol/l
Hämoglobin g/dl x 0,6206 = mmol/l
Harnsäure mg/dl x 59,485 = µmol/l
Harnstoff mg/dl x 0,1665 = mmol/l
5-HIES mg/l x 5,23 = µmol/l
HPL mg/l x 46,3 = nmol/l
17-OH-Steroide mg/die x 2,759 = µmol/l
Insulin mU/l x 7,2141 = pmol/l
Kalium mmol/l x 3,9102 = mg/dl
17-Ketosteroide mg/die x 3,467 = µmol/die
Kreatinin mg/dl x 88,4 = µmol/l
Kupfer µmol/l x 6,3546 = µg/dl
Lactat mmol/l x 9,008 = mg/dl
Lithium mmol/l x 0,693 = mg/dl
Magnesium mmol/l x 2,4312 = mg/dl
Metanephrine mg/die x 5,458 = µmol/l
b 2-Mikroglobulin mg/l x 84,75 = nmol/l
Myoglobin mg/dl x 0,585 = µmol/l
Natrium mmol/l x 2,2989 = mg/dl
Noradrenalin µg/24h x 5,91 = nmol/14h
Östradiol ng/l x 3,671 = pmol/l
Östriol µg/l x 3,47 = nmol/l
Parathormon ng/l x 0,106 = pmol/l
Phosphor anorg. mmol/l x 3,0974 = mgP/dl
Phospholipide mg/dl x 0,0129 = mmol/l
pO2, pCO2 mmHg x 0,1333 = kPa
Porphobilinogen mg/24h x 4,42 = µmol/d
Pregnantriol mg/14h x 2,972 = µmol/d
Prolactin ng/ml x 27,6 = mU/ml
Progesteron ng/ml x 3,18 = nmol/l
17-OH-Progesteron ng/ml x 3,026 = nmol/l
Pyruvat µmol/l x 0,0088 = mg/dl
T3 µg/l x 1,54 = nmol/l
T4 µg/l x 1,287 = nmol/l
FT4 µg/l x 1,287 = pmol/l
TBG mg/l x 17(12,87) = nmol/l
Testosteron ng/ml x 3,467 = nmol/l
Triglyceride mg/dl x 0,0114 = mmol/l
Vitamin A mg/l x 0,03491 = µmol/l
Vitamin B2 µg/dl x 26,57 = nmol/l
Vitamin B6 ng/ml x 5,982 = nmol/l
Vitamin B12 pg/ml x 0,7378 = pmol/l
25-OH-Vitamin D3 ng/ml x 2,496 = nmol/l
Vitamin C mg/l x 5,6776 = µmol/l
Vitamin E mg/dl x 23,22 = µmol/l
VMS mg/die x 5,046 = µmol/die
D-Xylose mg/dl x 0,0666 = mmol/l
Zink µg/dl x 0,153 = µmol/l
AP, GPT, GOT,
GGT, Amylase,
U/l x 16,67 =
x 0,01667 =
nkat/l
µkat/l


Version: 13.12.2023
Address of this page
Home
Joachim Gruber