"Adaptation" Model compared with "Complete"
and MIC Models and with Data
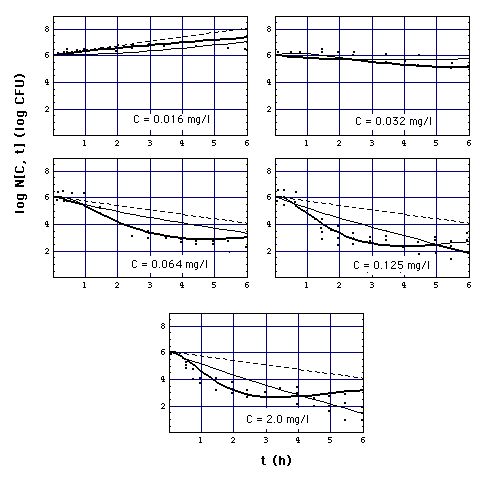
Fig. 5: Number N[C, t] of
S. aureus 1 organisms exposed to meropenem in vitro as a function of exposure
time t, calculated with
-
eq. (11) ("complete"
Emax model, heavy curves),
-
eq. (13) ("adaptation"
Emax model, normal curves),
-
eq. (6) (MIC model
with MIC = MBC = 0.03 mg/l, i.e. the surface N[C,t] in Fig. 1,
dashed curves).
-
Points are experimentally determined
numbers Nx[C,t] of S. aureus 1 (Fig.2 of [Mattie
et al]),
Back
version:19. Jan. 2004
URL
Home
Joachim
Gruber